OVERVIEW
Qvinci's latest new BI Tool is designed to facilitate reporting for accountants, franchises, dioceses, and other multi-unit organizations to better serve their business units with essential data. The KPI Scorecard is a customizable Business Intelligence tool that is designed to simplify a recipient’s understanding of where their business is performing well and the areas that require attention. The desired result is to motivate recipients to reach out to their accountant or operations team for assistance in correcting the areas that are negatively impacting their bottom line.
Qvinci’s KPI Scorecard empowers accountants, franchisors, faith-based organizations, nonprofits, and small and medium businesses to create:
- Custom KPIs (Key Performance Indicators) based on their own ecosystem metrics
- Consolidated KPIs across a plurality of franchises, dioceses, nonprofits, or single SMBs
- KPIs and compare them to peers of “like-users”
- Trended comparisons of KPIs year-over-year
- Conditional formatting indicating movement or trends
- Comparisons to the “ideal” range of values set by the manager or user
- Custom accounts based on your ecosystem’s unique metrics
Please review the video below, which explains in detail how to use the KPI Scorecard and the related KPI reports
Summary
Setting Up Your KPI Scorecard Involves a Simple 2- to 4-Step Process.-
Specify Chart of Accounts to display in KPI Scorecard in the #system-average-data tab
-
Copy & paste the specified Chart of Accounts to the #system-top20-data tab
-
Check For Copy & Paste errors using the #Getting Started tab
-
Classify Cost Accounts & Set Ideal Ranges in the #Getting Started tab
-
Specify Chart of Accounts to display in KPI Scorecard in the #data tab
-
Classify Cost Accounts & Set Ideal Ranges in the #Getting Started tab
Returning To Your KPI Scorecard Tab
Additional KPI-Related Reports
Getting Started
-
Select an Entity
a. Log in to your account via web.qvinci.com
b. Click on ‘Reports & Libraries’ on the left navigation bar
c. Select ‘Libraries’ on the drop-down menu
d. Navigate to the top of the page and click ‘Filter Entities’
e. Filter to 1 entity and click the ‘Apply Filters’ button
-
Open the KPI Scorecard Template
a. Navigate to the ‘Qvinci Gallery’ tab
b. Search for KPI Scorecard template
- For the Multi-Entity KPI Scorecard Template search for 'BI-KPI SC Multi-Entity-FYTD + % (S)'
- For the Single-Entity KPI Scorecard Template search for 'BI-KPI SC Single-Entity-FYTD + % (N)'
c. Click on the Edit
 button located to the right of the title
 -
Create a copy of the KPI Scorecard Template
a. Click on the Save As
 button located on the left navigation bar
b. Enter the desired name for your new KPI Scorecard and click 'Submit'
c. You are now in your new KPI Scorecard and ready to begin the setup process
Using KPI Scorecard
Multi-Entity KPI Scorecard
-
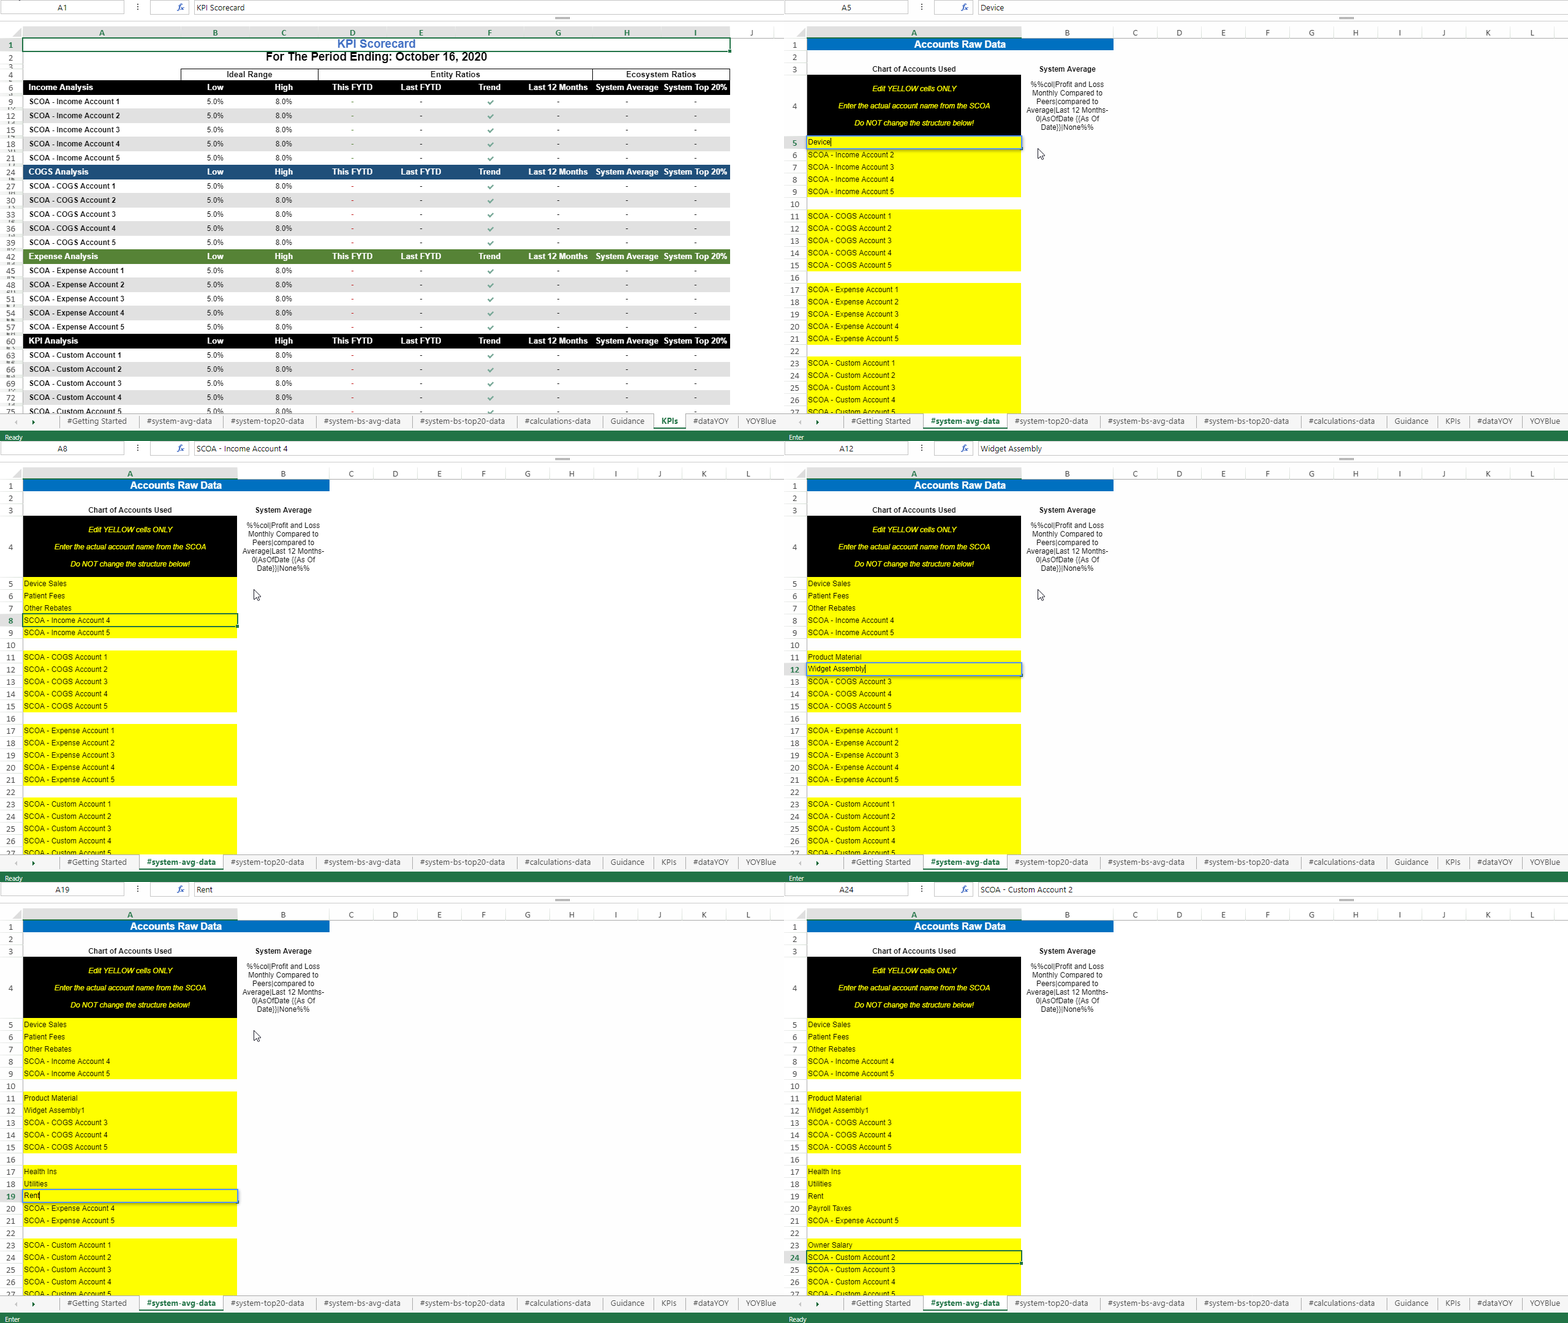
Specify Chart of Accounts to display in the KPI Scorecard
a. Navigate to the #system-avg-data tab
b. Modify the master Chart of Accounts with your actual SCoA names
⚠️ Do not change the structure and ONLY edit the cells highlighted in yellow
-
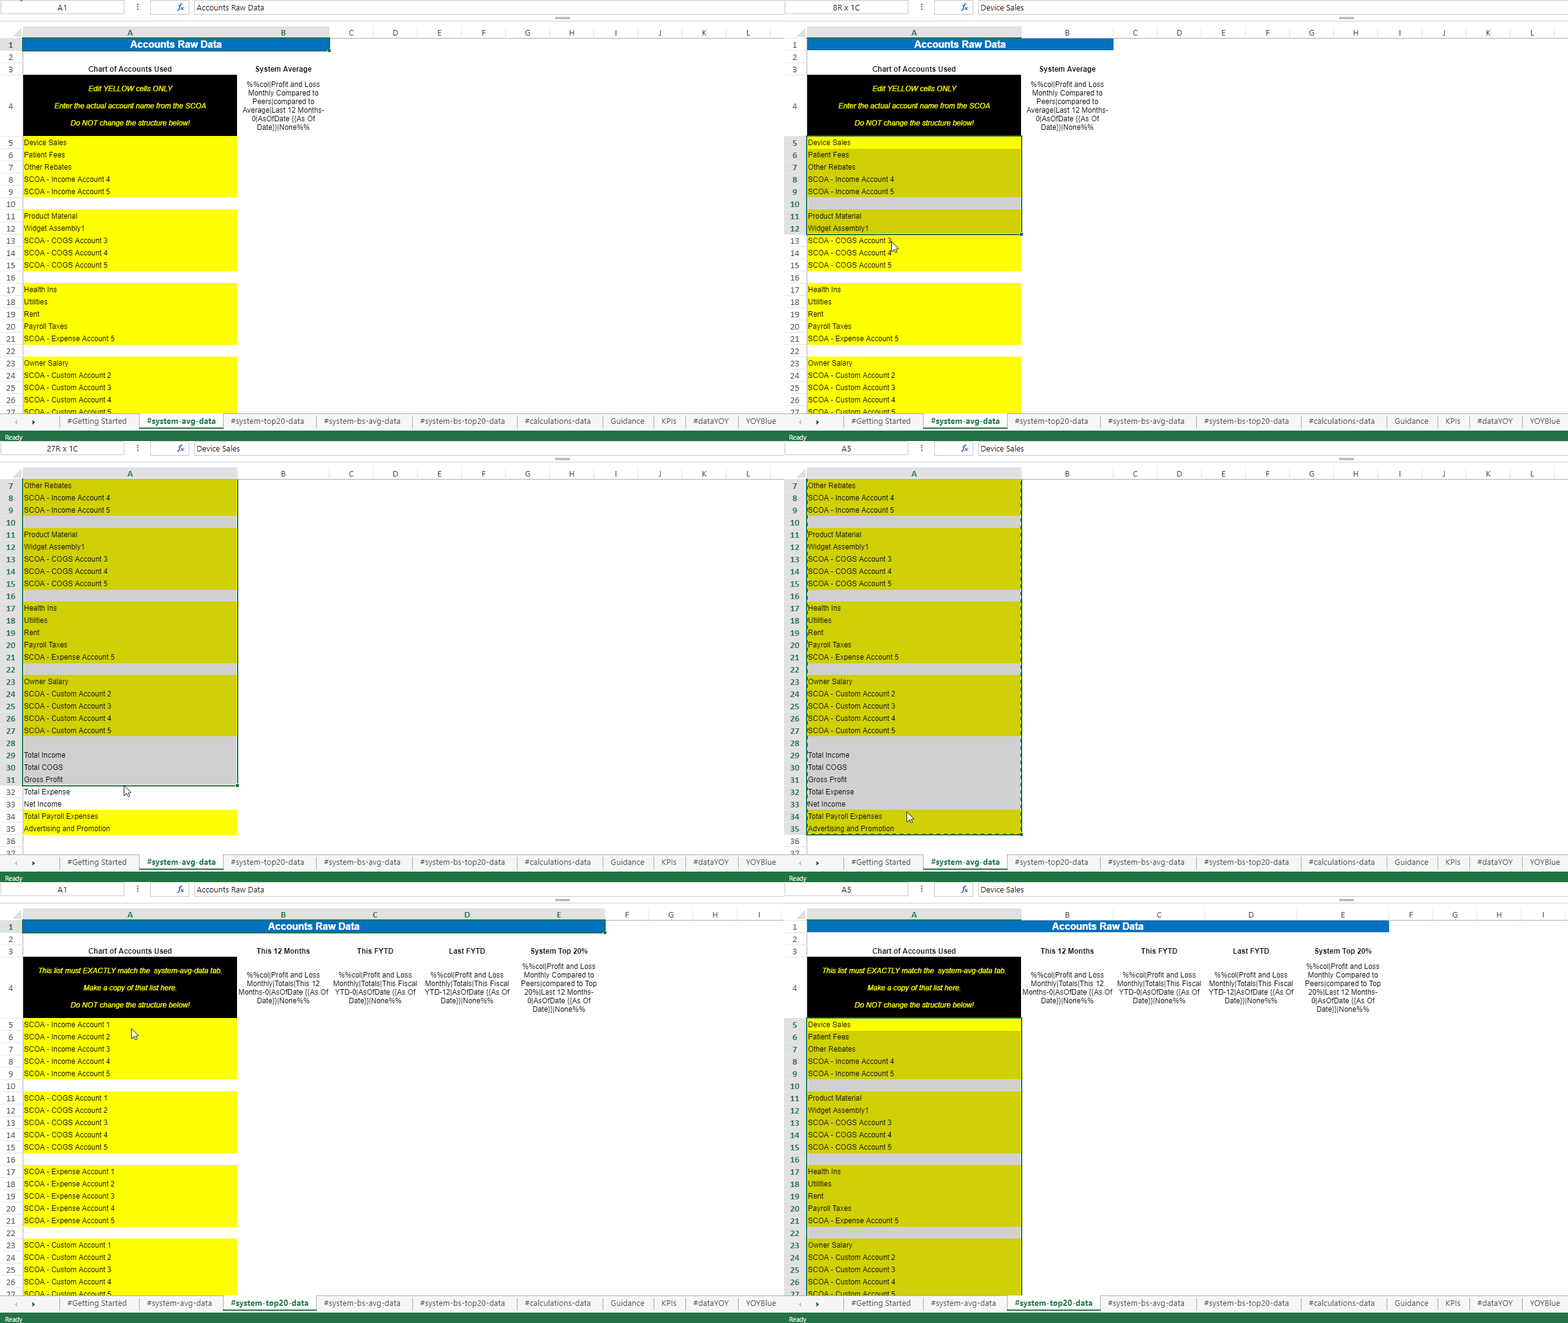
Copy & paste the specified Chart of Accounts
a. Navigate to the #system-avg-data tab
b. Select & Copy cells A5:A35
c. Navigate to the #system-top20-data tab
d. Click on cell A5 and Paste
❗ After completing the previous step, the #system-avg-data and the #system-top20-data should have an identical Chart of Accounts structure
-
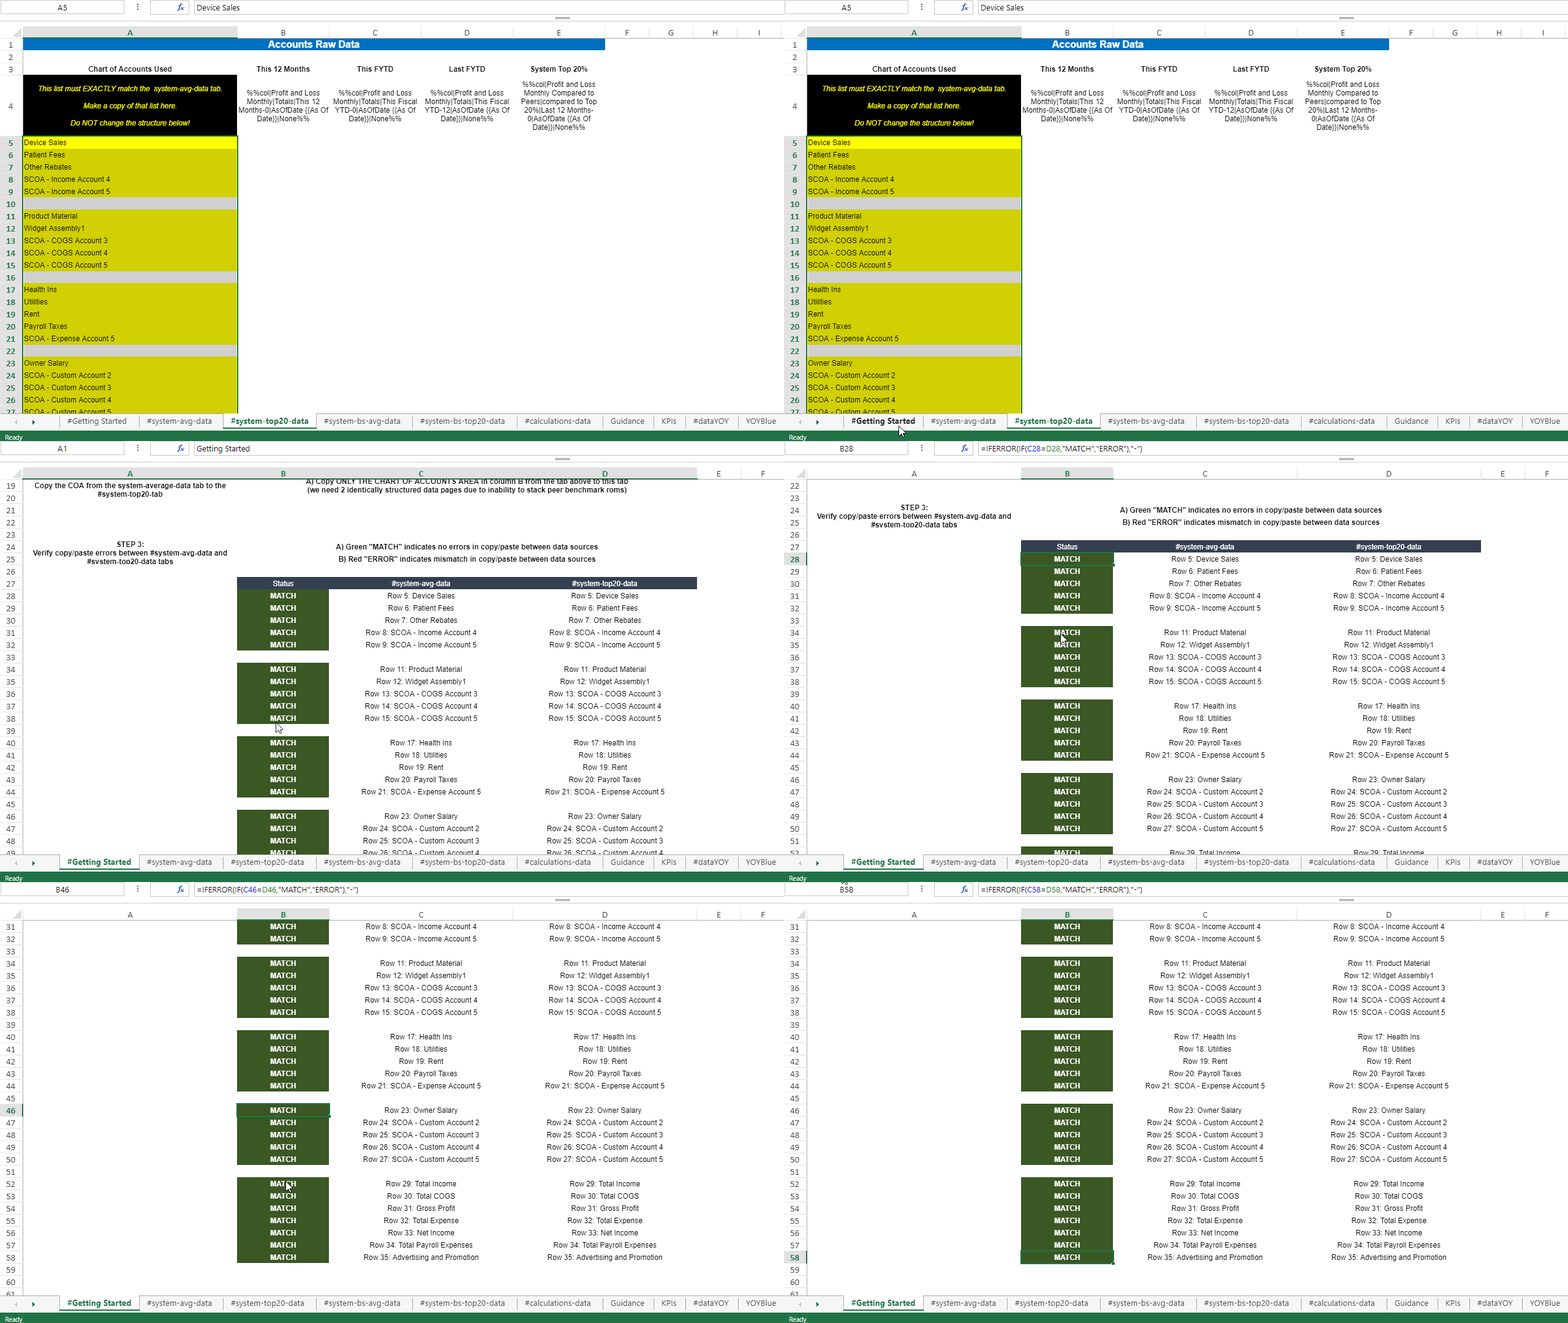
Check for copy & paste errors
a. Navigate to the #Getting Started tab
b. Verify for complete
c. Upon verifying a complete statuses under 'STEP 3'
 you are now free to move on to the final step
⚠️ An
 indicates a mismatch after Copy/Paste between tabs - repeat Step 2
-
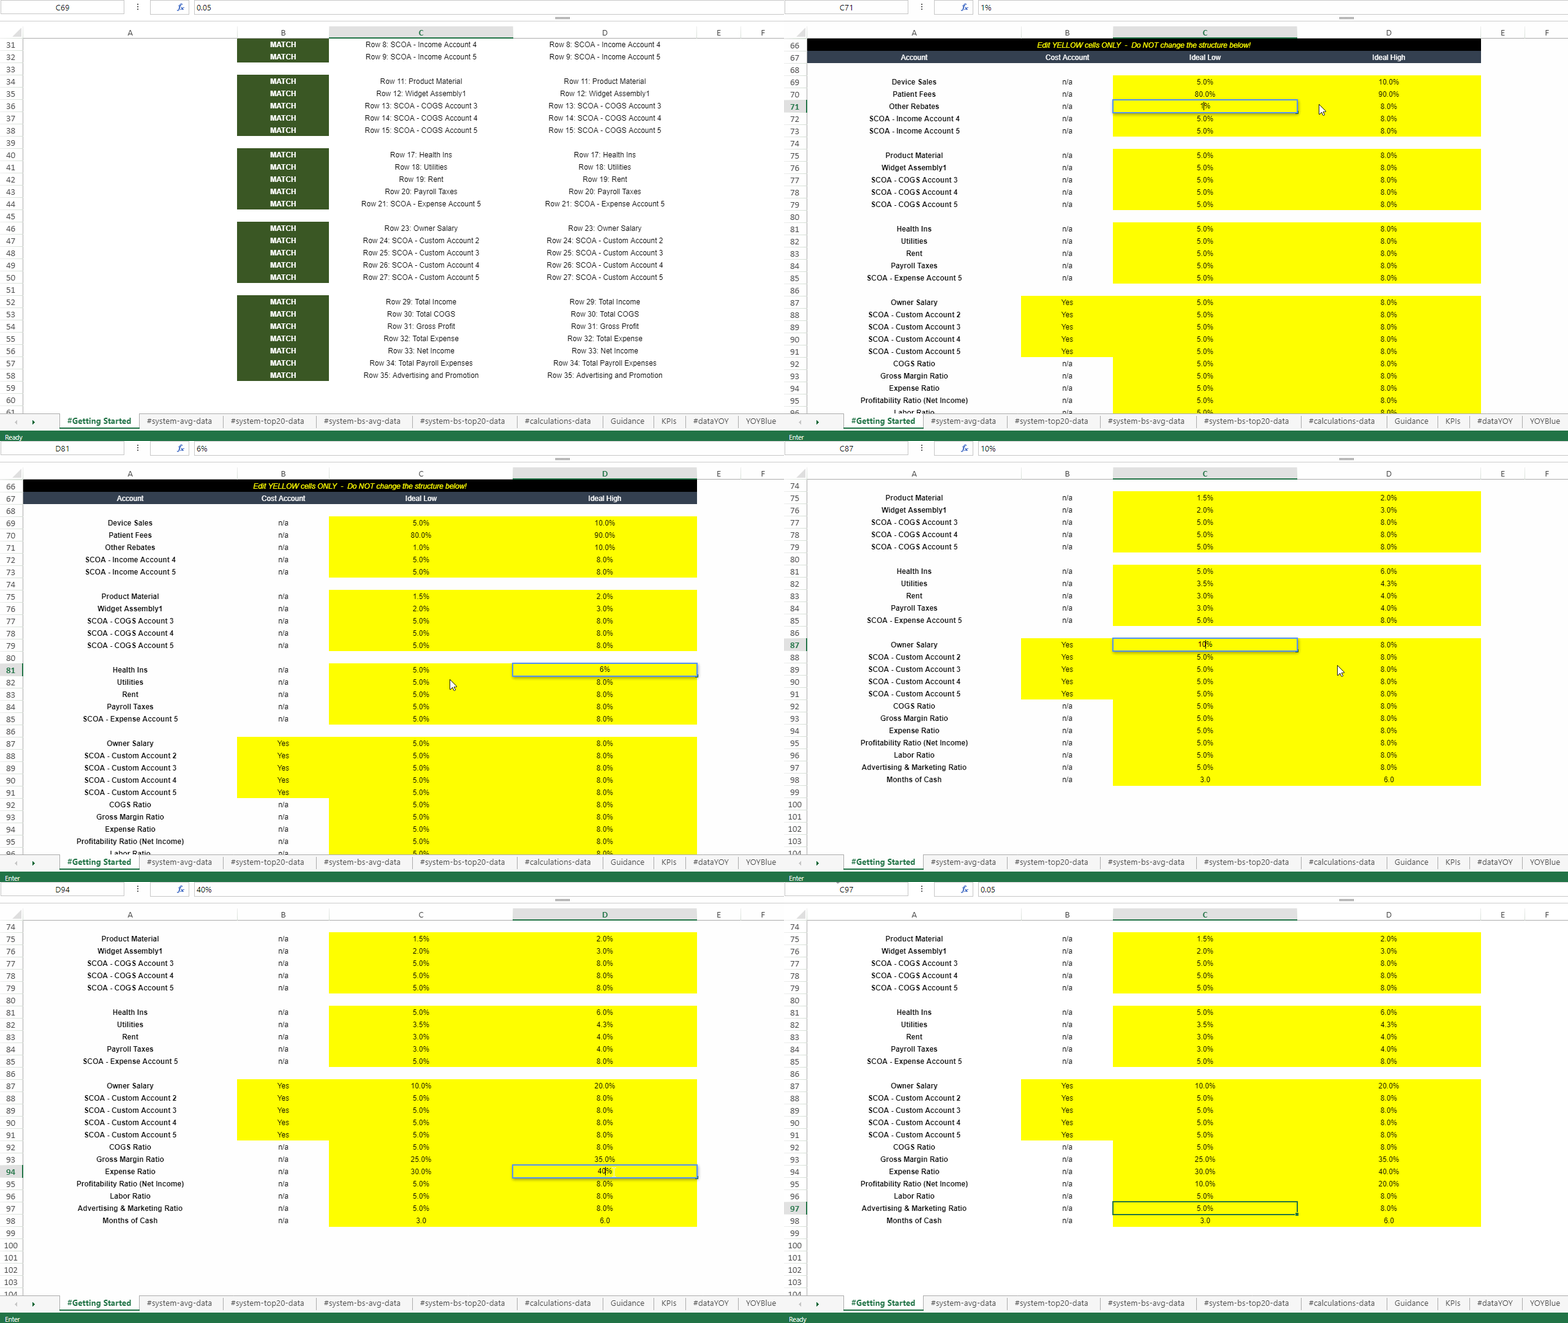
Classify cost accounts & set ideal ranges
a. Navigate to the #Getting Started tab
b. Classify Custom Accounts 1-5 as Cost Accounts using the 'Yes' 'No' drop-down
c. Set your Ideal Low and Ideal High ranges for your specified SCOA accounts
d. Save your changes by using the button located on the bottom left navigation bar
⚠️ Do not change the structure and ONLY edit the cells highlighted in yellow
-
Save changes & run your KPI Scorecard
a. Setup is now complete - use the
 button located on the bottom left navigation bar to run and view your report
b. (Optional) Export KPI Scorecard to PDF or Excel
- To export to PDF, use the Export PDF
- To export to Excel, use the Export Excel button located on the bottom left navigation bar
 button located on the bottom left navigation bar
Single-Entity KPI Scorecard
-
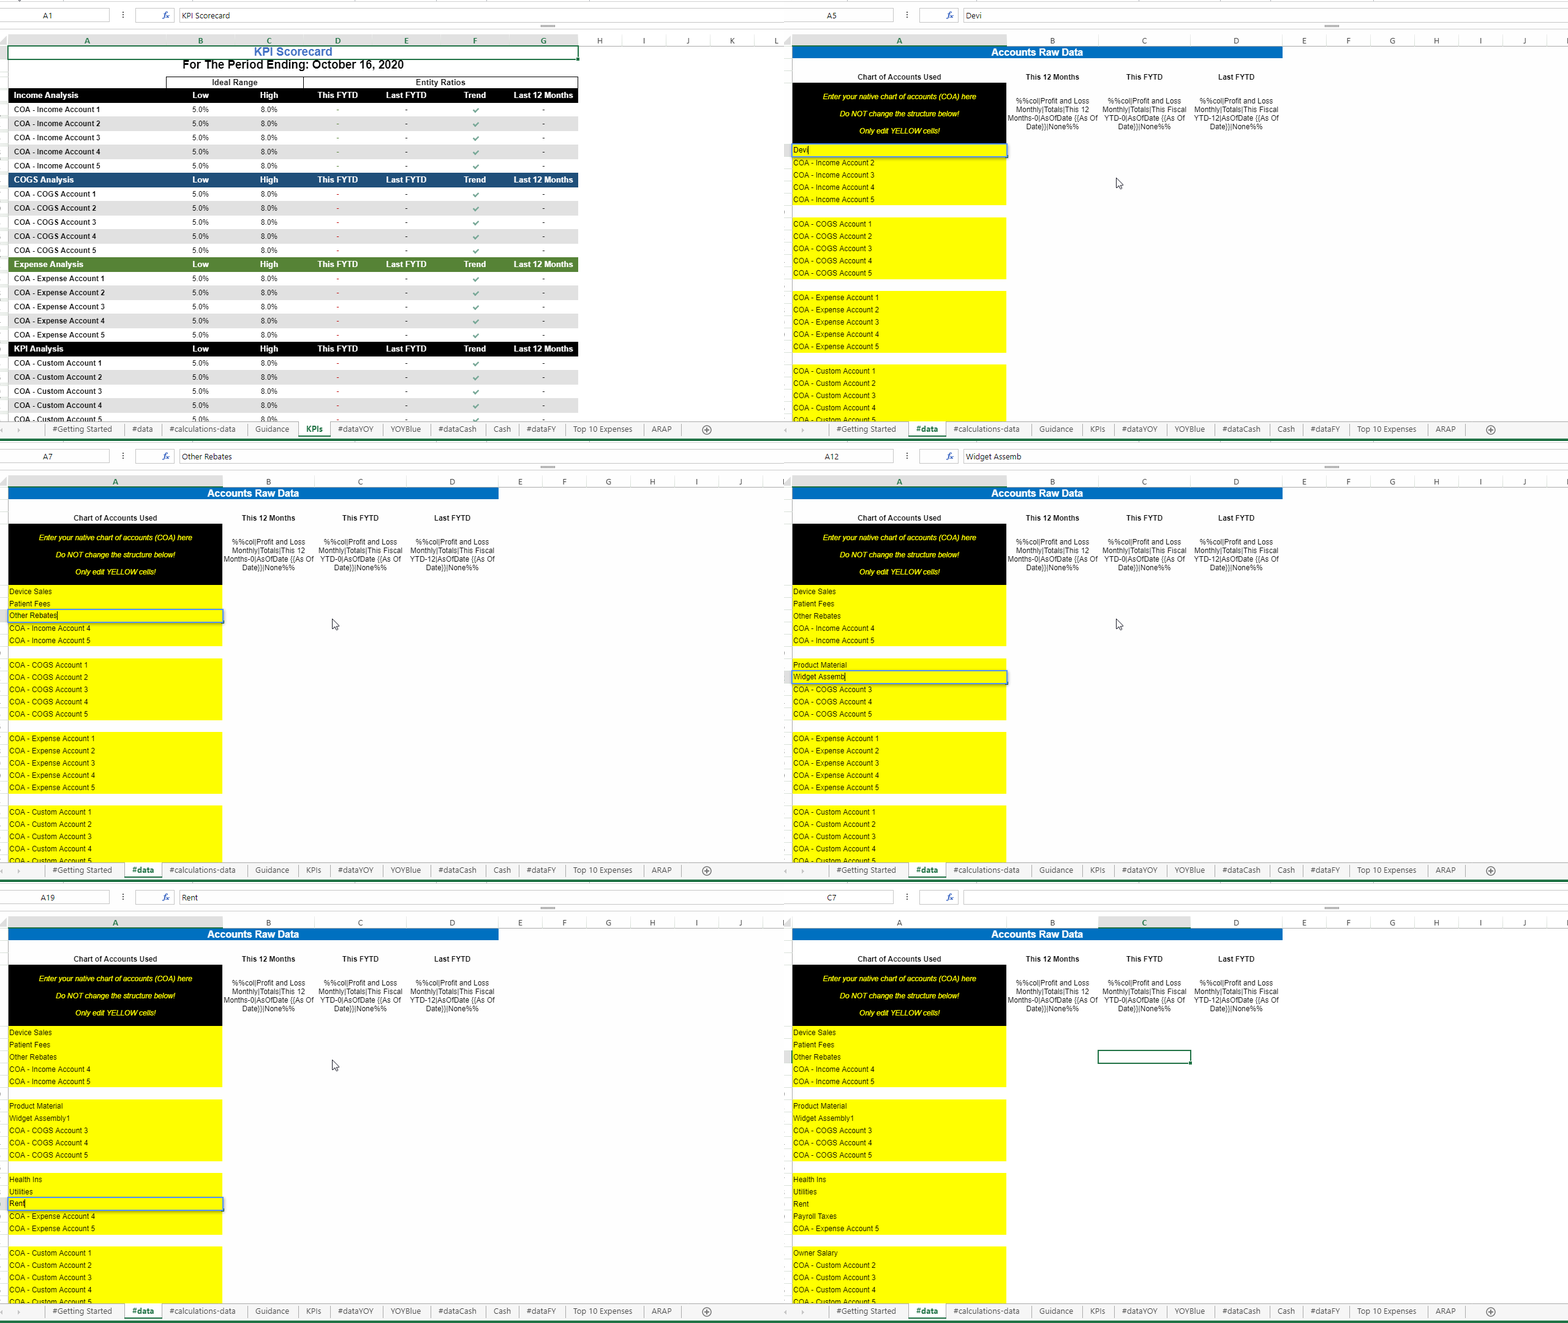
Specify Chart of Accounts to display in the KPI Scorecard
a. Navigate to the #data tab
b. Modify the master Chart of Accounts with your actual Native COA names
⚠️ Do not change the structure and ONLY edit the cells highlighted in yellow
-
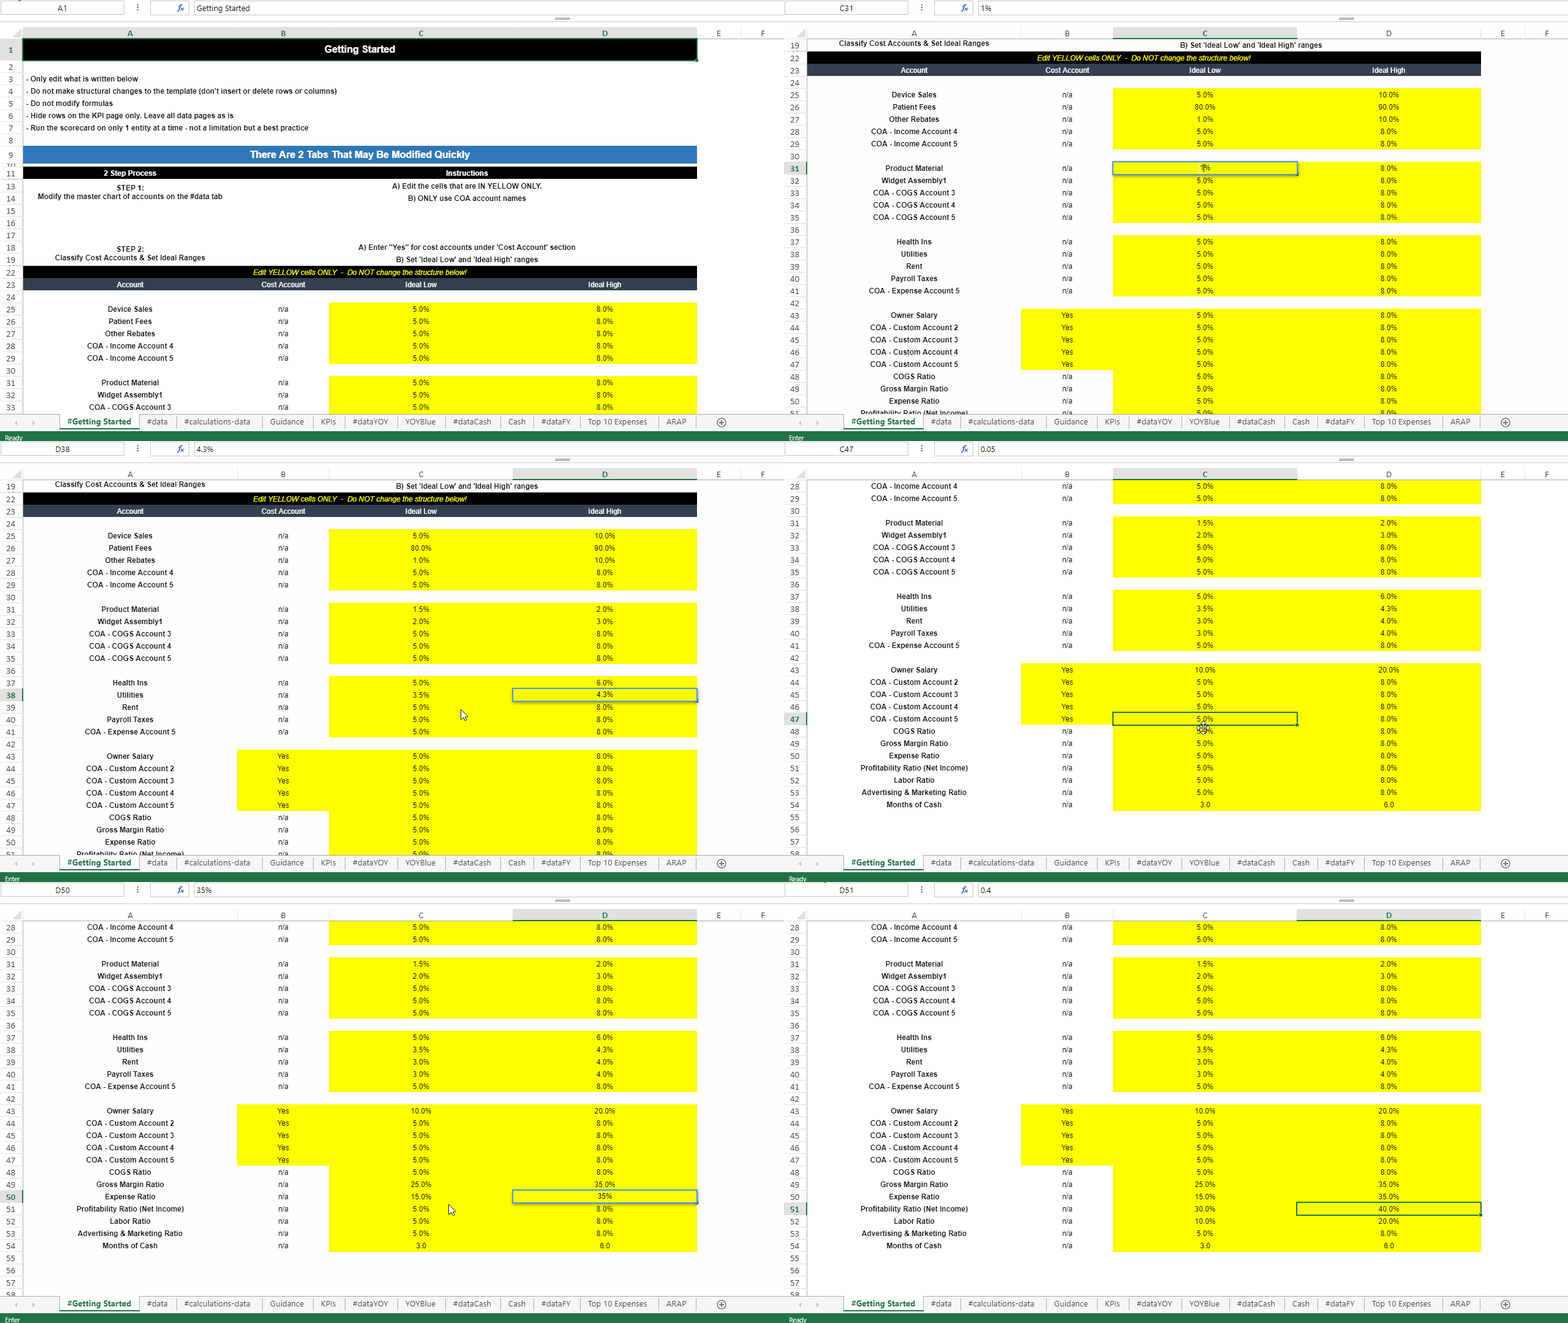
Classify cost accounts & set ideal ranges
a. Navigate to the #Getting Started tab
b. Classify Custom Accounts 1-5 as Cost Accounts using the 'Yes' 'No' drop-down
c. Set your Ideal Low and Ideal High ranges for your specified COA accounts
d. Save your changes by using the Save button located on the bottom left navigation bar
e. Your KPI Scorecard is now complete - use the Preview
 button on the bottom left navigation bar to run and view your report.
⚠️ Do not change the structure and ONLY edit the cells highlighted in yellow
-
Save changes & run your KPI Scorecard
a. Setup is now complete - use the Preview
 button located on the bottom left navigation bar to run and view your report
b. (Optional) Export KPI Scorecard to PDF or Excel
- To export to PDF, use the Export PDF
- To export to Excel, use the Export Excel button located on the bottom left navigation bar
 button located on the bottom left navigation bar
Returning To Your KPI Scorecard
-
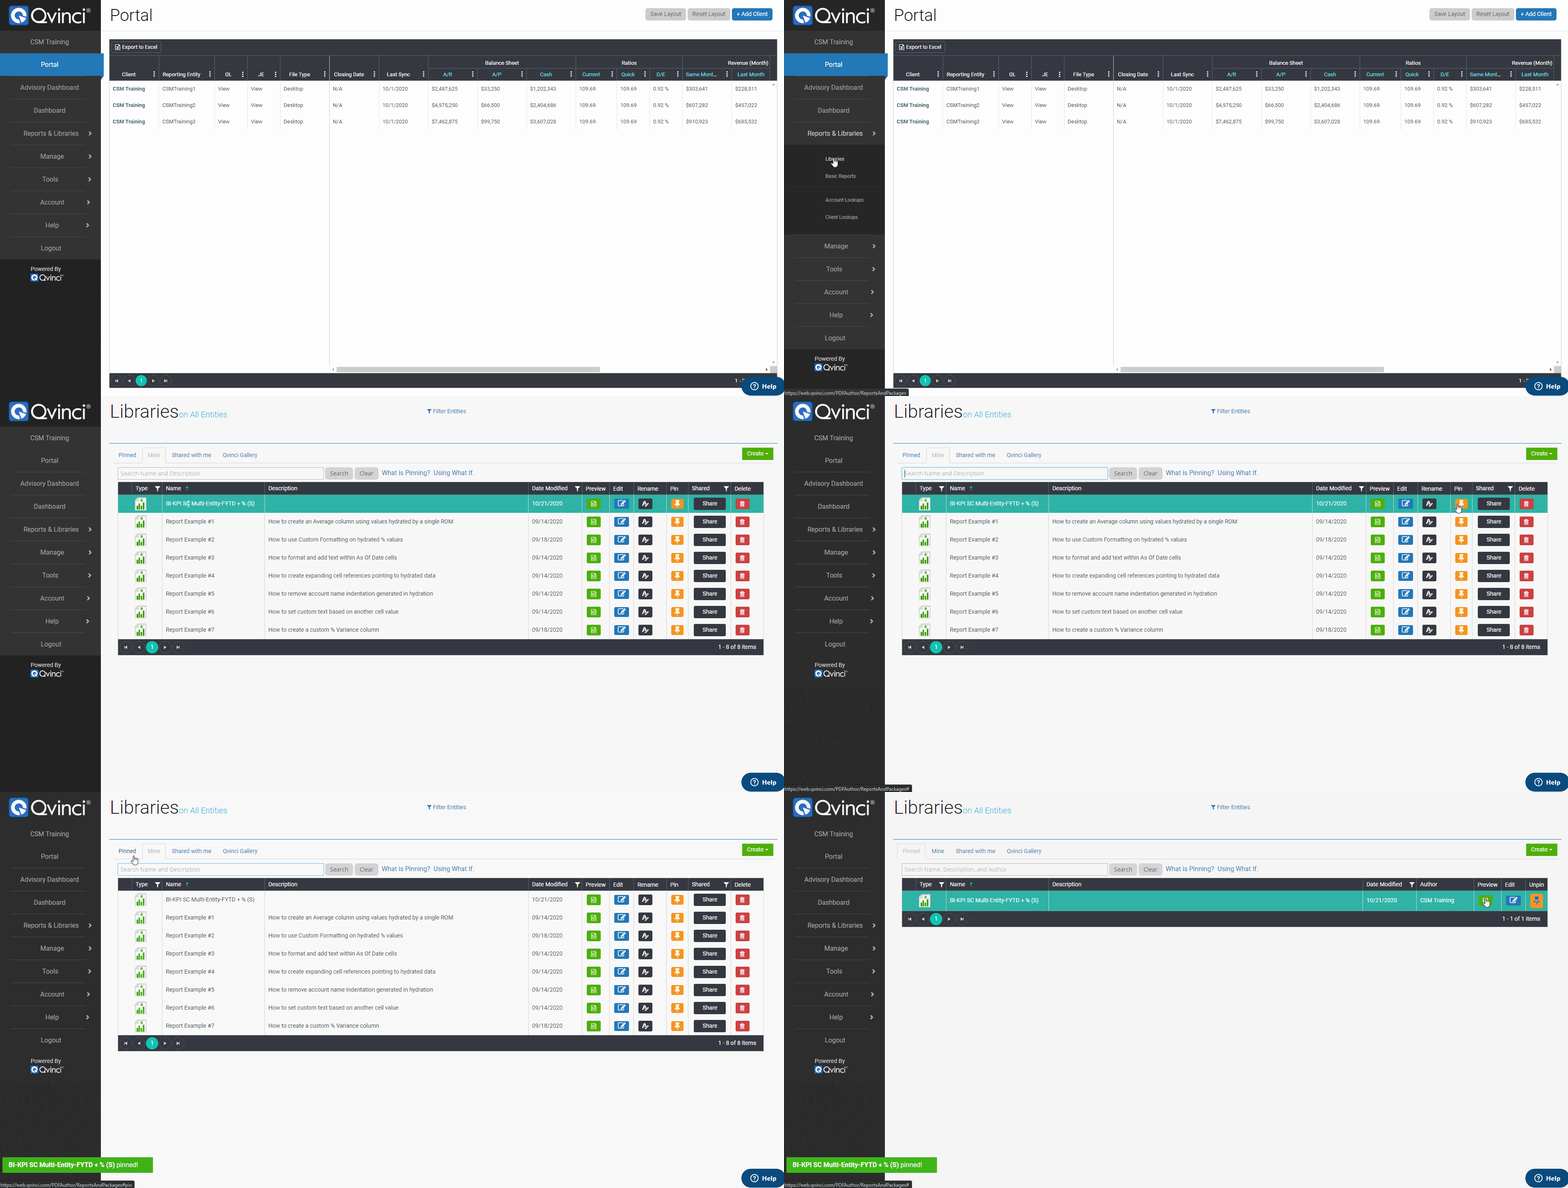
Pin the KPI Scorecard
a. Click on ‘Reports & Libraries’ on the left navigation bar
b. Select ‘Libraries’ on the drop-down menu
c. Navigate to the ‘Mine’ tab
d. Search for the previously created KPI Scorecard
e. Click the Pin
 button located to the right of the title to pin your KPI Scorecard
❗ Pinned items can be seen by any users who have been granted access to the specific Client/Company to which the item, report, or package was pinned
-
Open the KPI Scorecard
a. Navigate to the ‘Pinned’ tab
b. Search for the previously pinned KPI Scorecard
c. Click the Preview
 button located to the right of the title to preview your KPI Scorecard
Additional KPI-Related Reports
When an accountant, manager, or business advisor can show a client or business unit “what to do” that is easily understood, implemented, and tracked — that is truly transformative. Some additional functionality of the KPI Scorecard provides numerical and graphical analysis of:
- Total Income and Net Income Year-Over-Year by Month
- Running Cash Balance Analysis Year-Over-Year by Month
- Top 10 Expenses Analysis
- AR and AP Analysis with Variance
Total Income and Net Income Year-Over-Year by Month
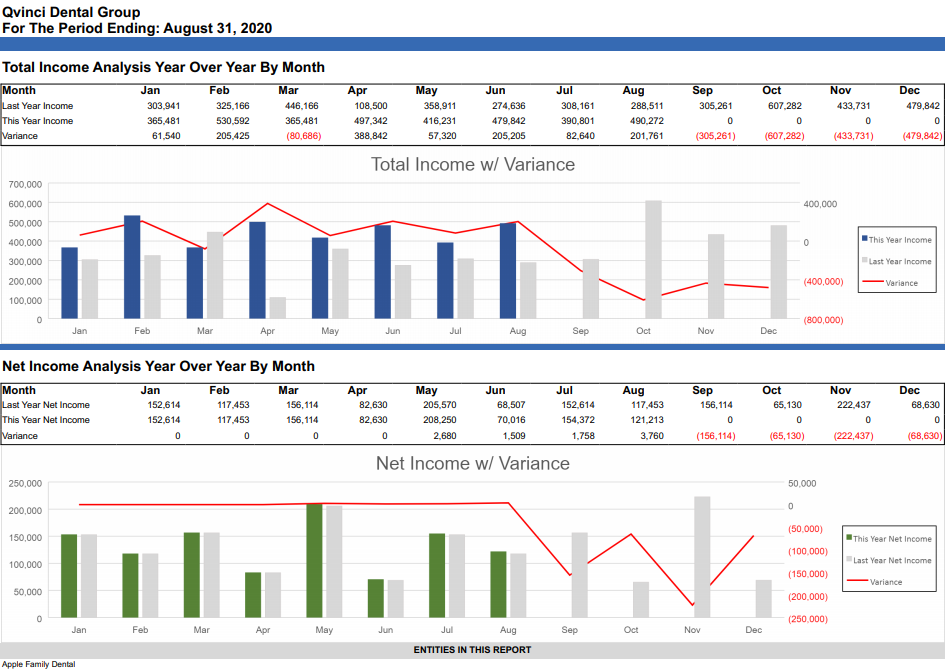
This KPI presents a year-over-year KPI for both total income and net income with variance. This is presented both in summary numerical and graphical presentations. The red line on the horizontal axis shows the variance. When the red line falls below zero on the right vertical axis, that indicates negative progress. This presentation is automatic and does need and additional input by the user.
Running Cash Balance Analysis Year-Over-Year by Month
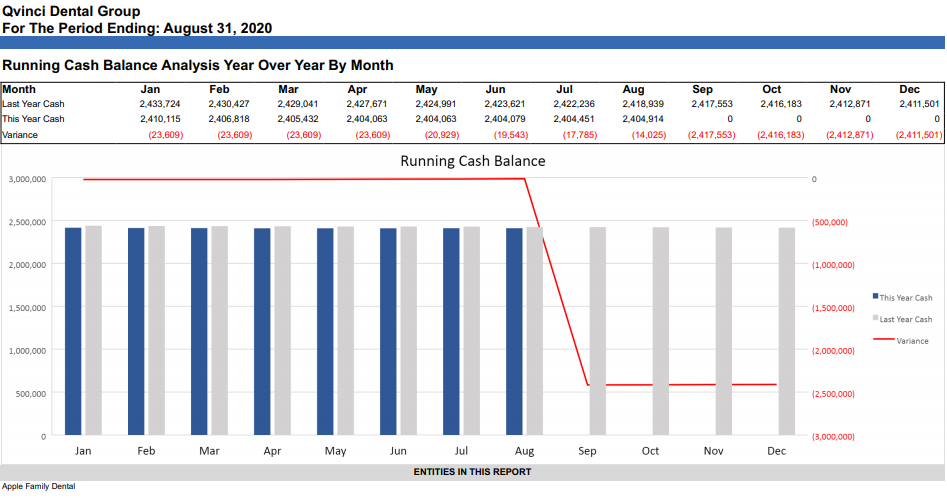
This KPI presents a running cash balance analysis year-over-year and by month with a variance in both numerical and graphical presentations. The red line on the horizontal axis shows the variance. When the red line falls below zero on the right vertical axis, that indicates negative progress. This presentation is automatic and does need and additional input by the user.
Top 10 Expenses Analysis – Top 10 Expenses
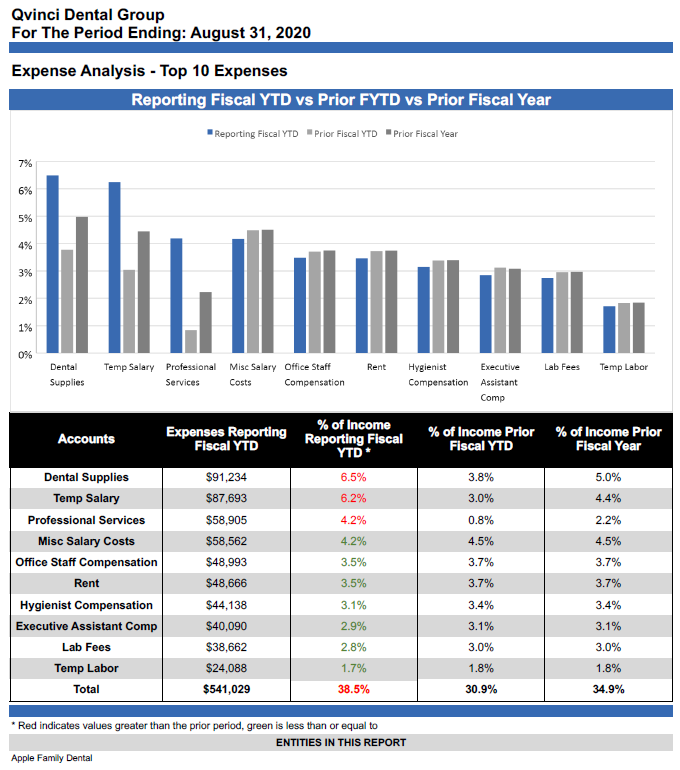
This KPI presents an analysis of the top 10 expenses in descending order with variance year-over-year. This presentation is automatic and does need additional input by the user.
AR and AP Analysis with Variance
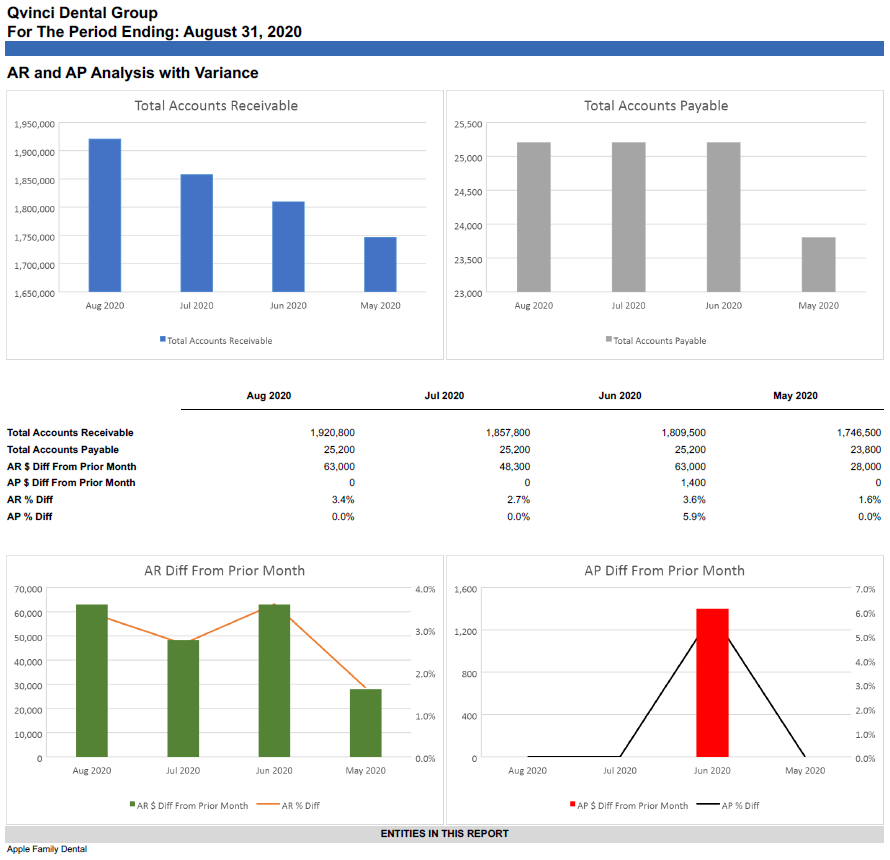
The last KPI in the package is the Accounts Receivable (“AR”) and Accounts Payable (“AP”) analysis with variance month over month. This is presented both in numerical and graphical presentations. This presentation is automatic and does not need additional input by the user.
Have Questions?
We're More Than Happy to Help
Schedule a call with Customer Success below, email us at support@qvinci.com or call us at 1-512-637-7337 Ext. 1 Available M-F, 7:30am-6:30pm CT and it is always FREE!

Comments
0 comments
Please sign in to leave a comment.