Overview
Financial ratios are indicators of a location’s performance and financial health. Ratios are derived from financial information such as revenue or the value of assets during the fiscal year.
Mathematically, ratios are one value compared to another, typically using simple division. They are used by bankers and investors to determine whether the business is a sound investment and should be extended a line of credit.
Ratios can represent several different indicators of the business’s health, such as liquidity, efficiency, solvency, and profitability.
A single ratio by itself is a poor indicator of performance while using ratios of each type can provide a more complete picture. To be meaningful, a ratio must be compared to historical values from the same location or against similar locations within the same business.
Ratios are useful for comparing locations because it allows you to compare two companies that may do business on different volumes of scale. A location that does $400,000 in revenue can compare its financial ratios against a location that brings in $4 million in revenue.
View Ratio Report
Follow these steps to generate a ratio report:
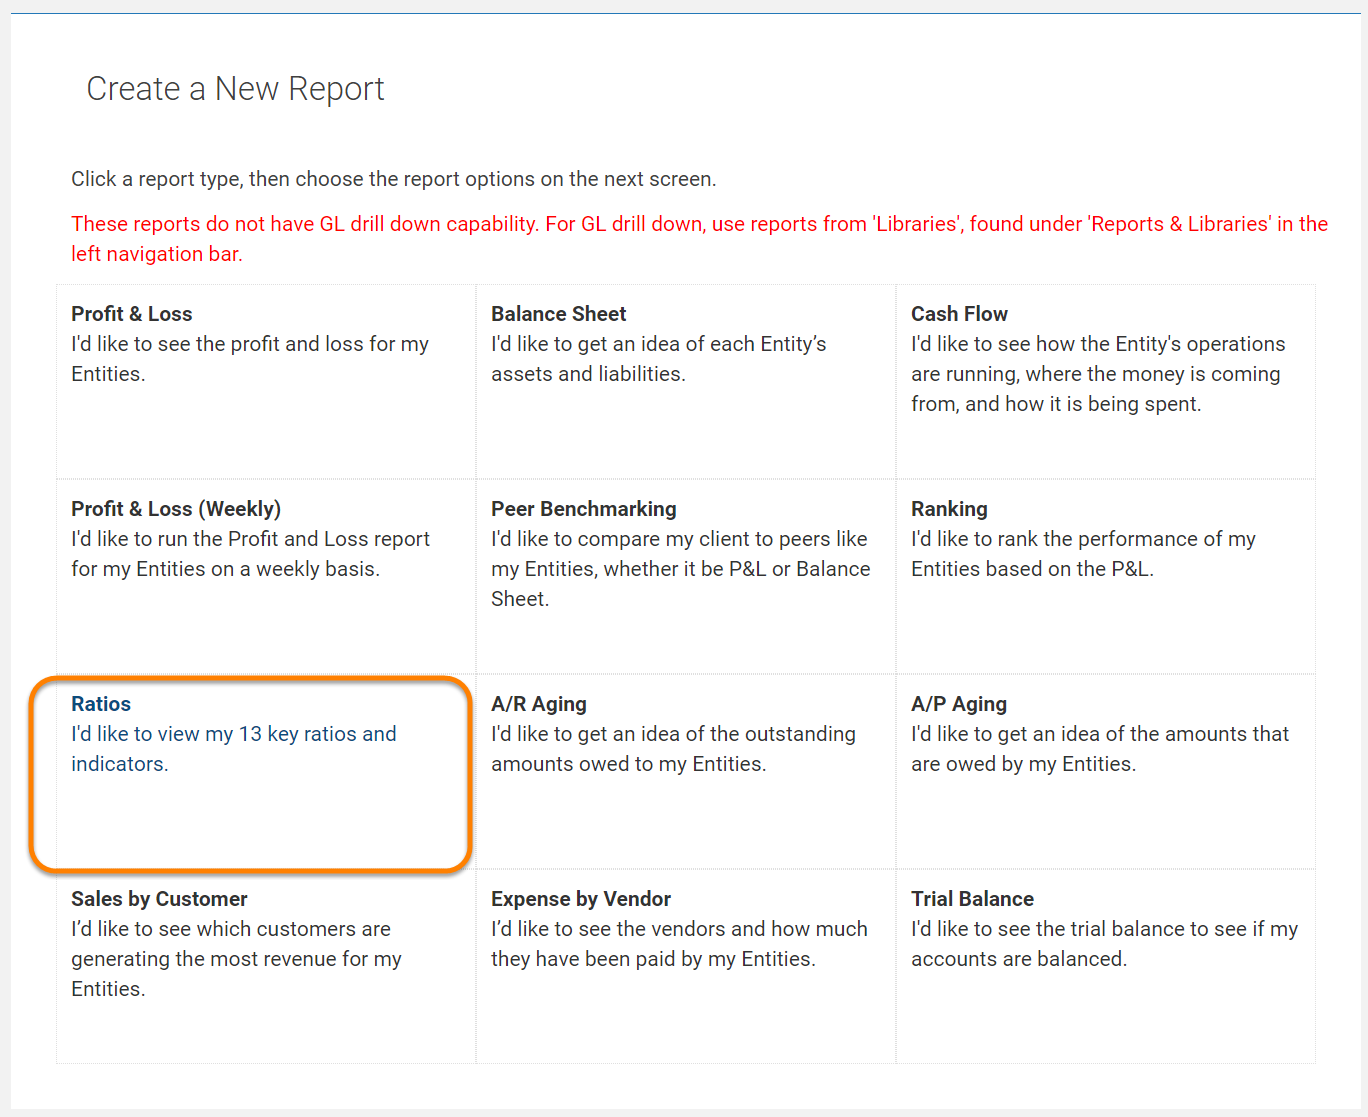
Step 1. Go to Reports & Libraries > Basic Reports > Ratios

Step 2. Select Entities:

-
- To view the report for ALL Entities, simply select the Ratio report. All Entities are always selected by default.
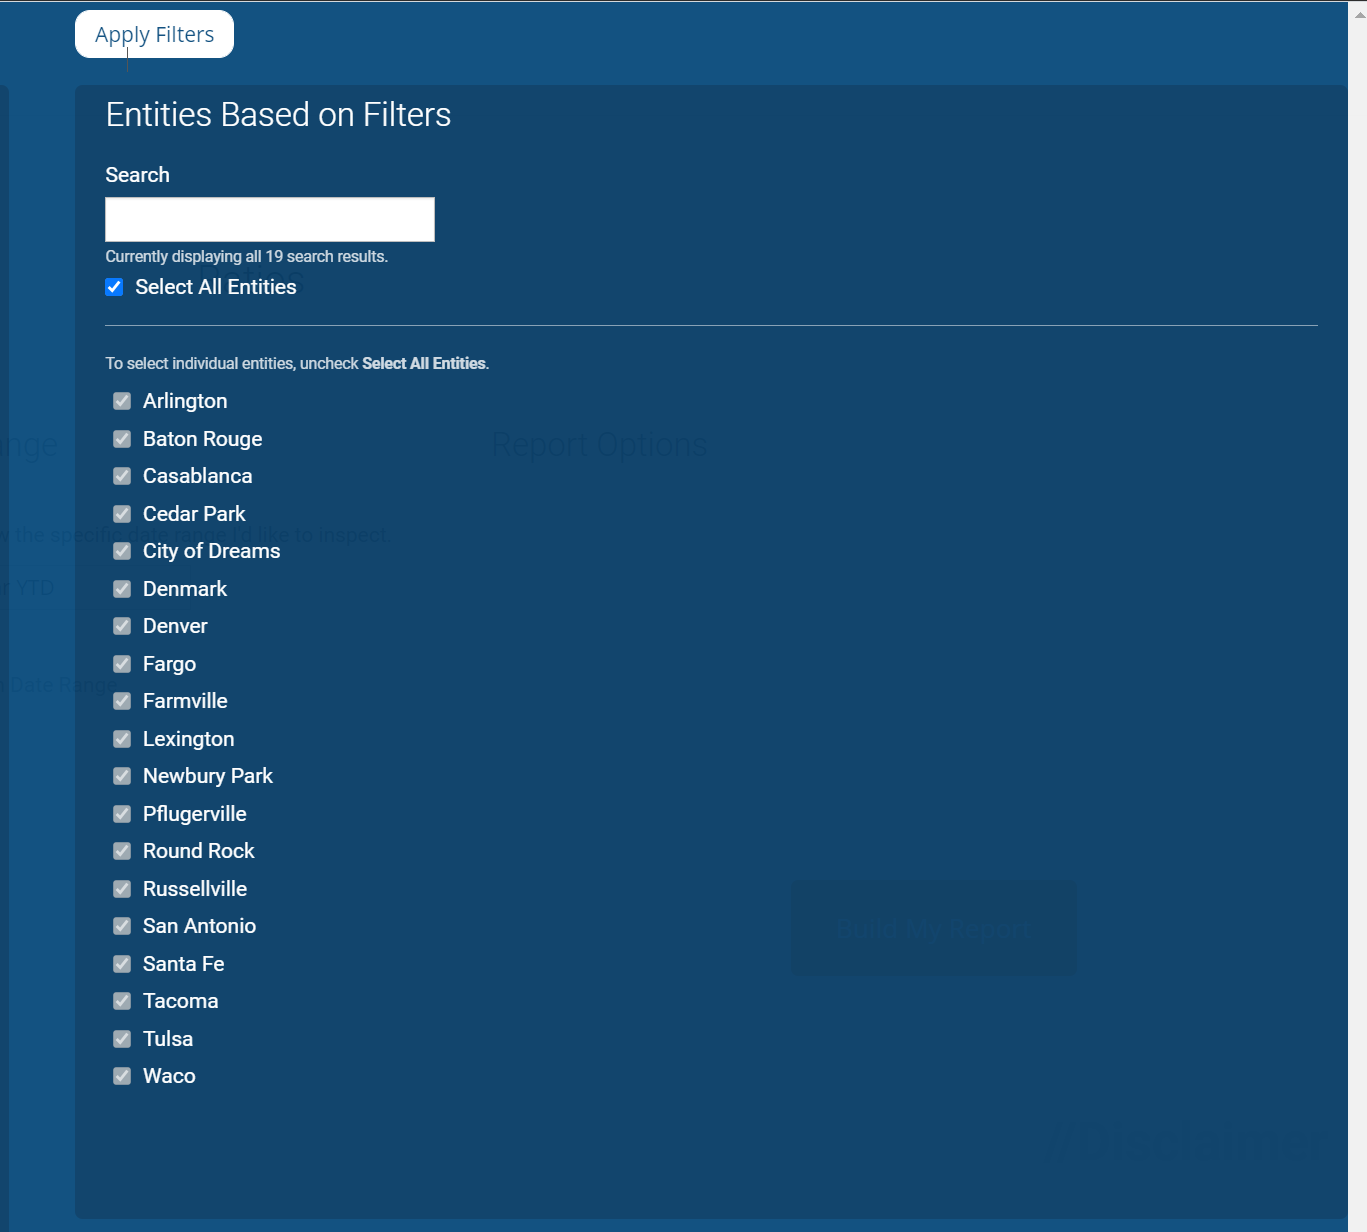
- To enroll a specific grouping of Entities in the report, select the "Filter Entities" option at the top center. Select any filter group you wish from the left and click "Apply filters."
- To enroll one or a few Entities in the report, click the “Filter Entities” option at the top-center. Under "Search Entities" deselect the "Select All Entities" box and instead check-mark or search for desired Entities. Click "Apply" to save your preference.
Step 3. Select the "Frequency" and "Date Range" for the report.

Step 4. Click the “Build My Report” ![]() button.
button.
Standard Ratio Calculations
Ratios were developed by brokers, stock analysts, and bankers to look at the financial health of publicly traded and privately held companies. Often this analysis is done at the end of the company’s fiscal year when their financials are released. Ratios are then used to determine a company's relative strength compared to the rest of the industry and to past performance.
Understanding the methodology for the calculation is critical to the interpretation of the ratios. Although the values used to calculate ratios are consistent, the results can vary wildly, depending on the date range selected for the calculation. Qvinci has standardized the way ratios are calculated. The following are how Qvinci calculates Ratios.
Have Questions?
We're More Than Happy to Help
Schedule a call with Customer Success below, email us at support@qvinci.com or call us at 1-512-637-7337 Ext. 1 Available M-F, 7:30am-6:30pm CT and it is always FREE!

Comments
0 comments
Article is closed for comments.