Overview
Multiple comparison reports are available in Qvinci. These reports are available for Profit & Loss (P&L) and Balance Sheet and allow the User to compare multiple Entities/Locations based on the income line in P&L. Entities rendering $0.00 in Total Income (for the selected date range of the report) won’t be counted in the benchmark average or appear for comparison.
Turn Off Comparison Reports
The Qvinci Administrator may opt to turn off the ability for Entity Viewers and Contributors to run comparison reports. The comparison reports will still be available for the Qvinci Admin, Company Viewers, and Business Managers. This allows companies with a small number of locations to still run comparison reports at the corporate level, but also retain the anonymity of financial data at each location since individual users cannot run the reports.
Step 1. The Qvinci Administrator logs into their account.
Step 2. From the menu on the left, choose Manage > Company.
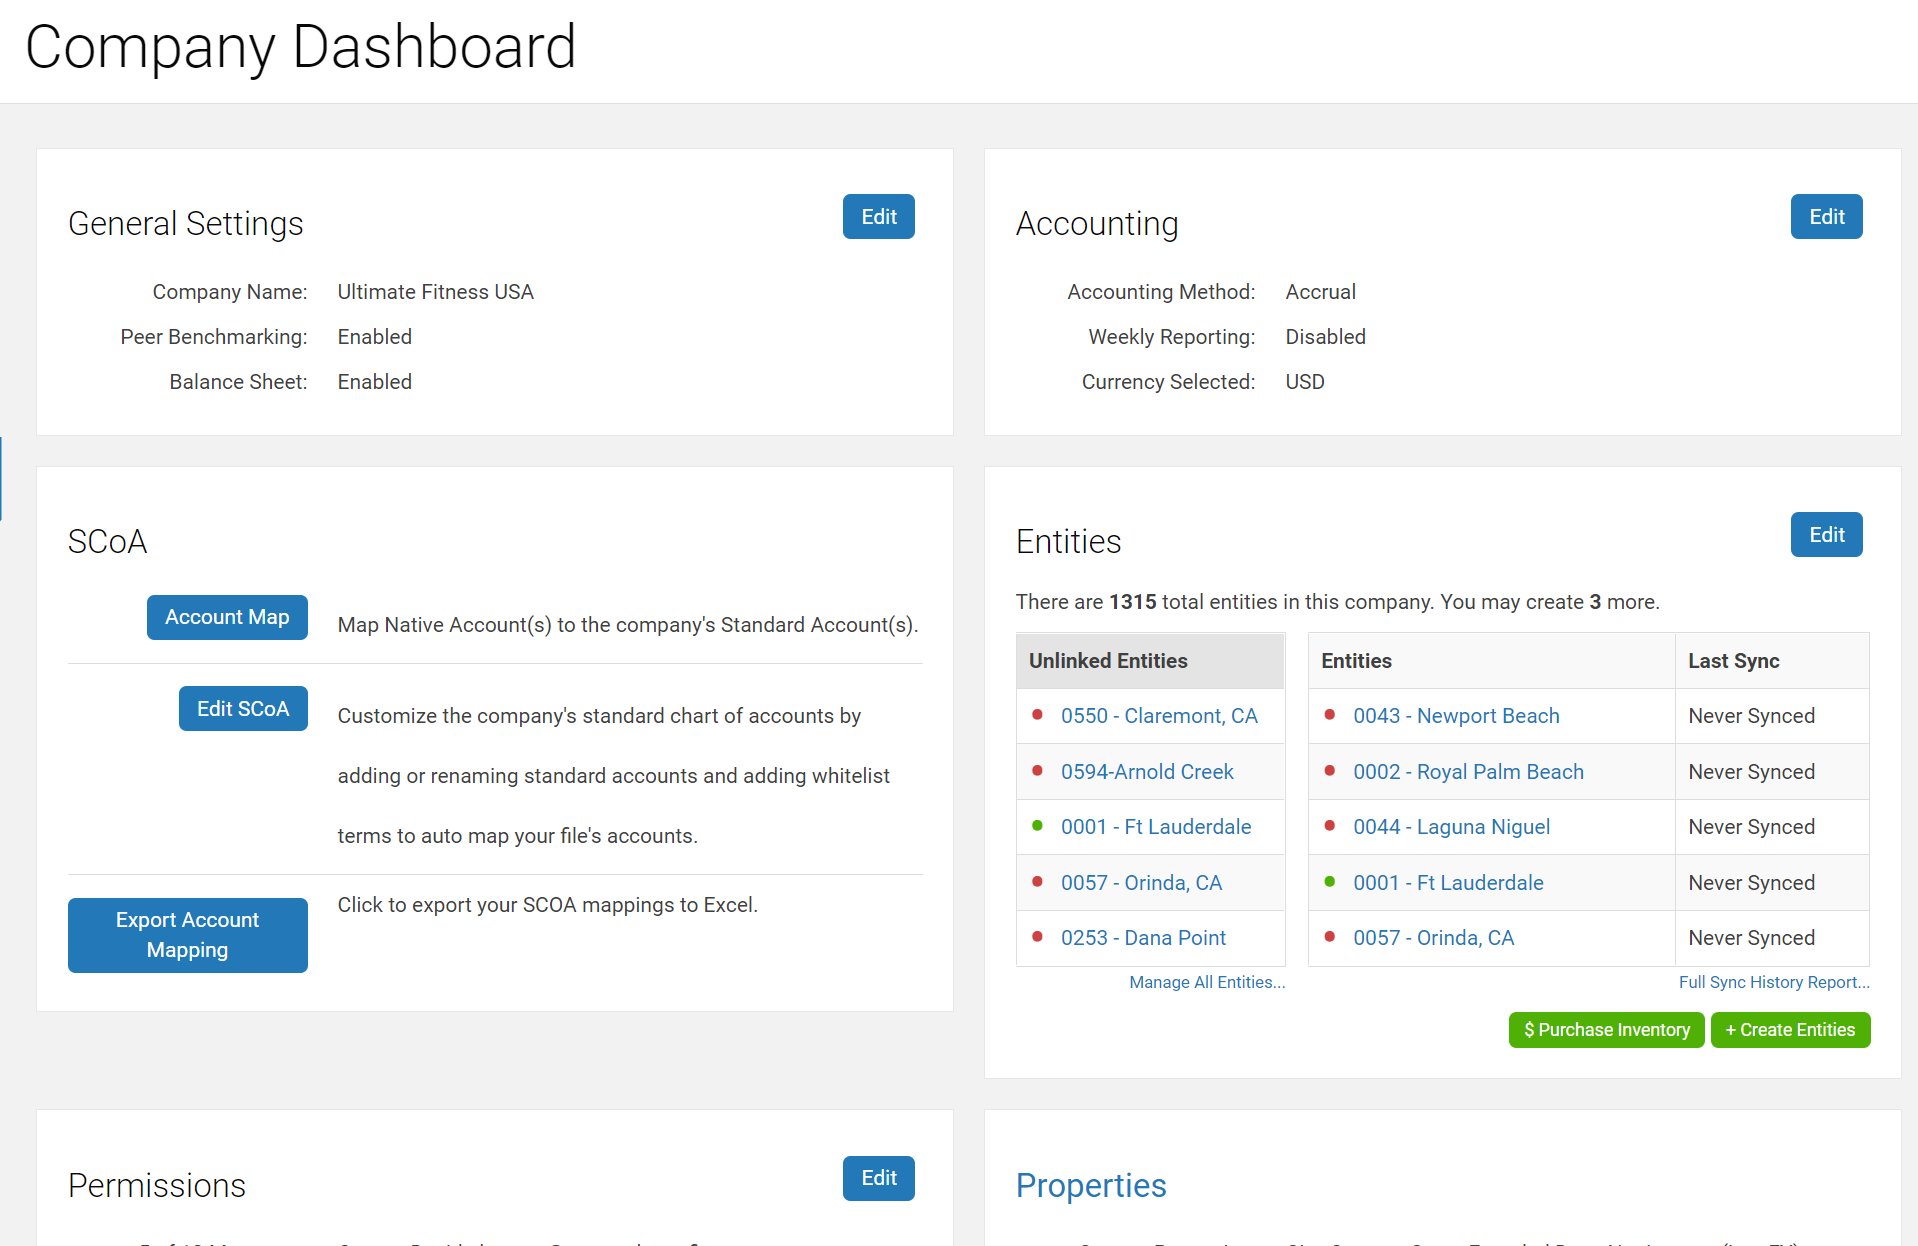
Step 3. In the General Settings section select Edit.
Step 4. Make desired changes to the Peer Benchmarking selection.

Step 5. Save the changes.
Available Company Comparison Reports
Compare to the Top 10% Best Performers
The Top 10% comparison report is anonymized for franchisee visibility. This means that franchisees may run this report and view ONLY the locations they own, but they see the anonymous values for the average. However, they will not know which locations make up the average category.
The Top 10% comparison report is based on the Income line of the P&L (top 10% of Entities by income). This report will display the average of the top 10% of performers (by income) in the Company. Any Entities the User selected will then be displayed side-by-side for comparison purposes. Please note that if a selected Entity does not contain any financial data in the income line of its P&L, that Entity will be omitted from the report.
Compare to the Top 20% Best Performers
The Top 20% comparison report is anonymized for franchisee visibility. This means that franchisees may run this report and view ONLY the locations they own but see the anonymized values for the average. However, they will not know which locations make up the average category.
The Top 20% comparison report is based on the Income line of the P&L (top 20% of Locations by income). This report will display the average of the top 20% of performers (by income) in the Company. Any Entities the User selected will then be displayed side-by-side for comparison purposes.
Note: If a selected Entity does not contain any financial data in the income line of its P&L, that Entity will be omitted from the report.
Compare to the Company Average
The Company Average report is anonymized for franchisee visibility. This means that franchisees may run this report and view ONLY the locations they own, but still will see anonymized values for the average. However, they will not know which locations make up the average category.
The Company Average report allows a User to compare one, many, or all Entities to the average of the whole.
Note: If a selected Entity does not contain any financial data in the income line of its P&L, that Entity will be omitted from the report.
To View Reports for ALL ENTITIES (users only see Entities they have visibility to).
Step 1. In the navigation, go to the menu Reports & Libraries > Basic Reports.
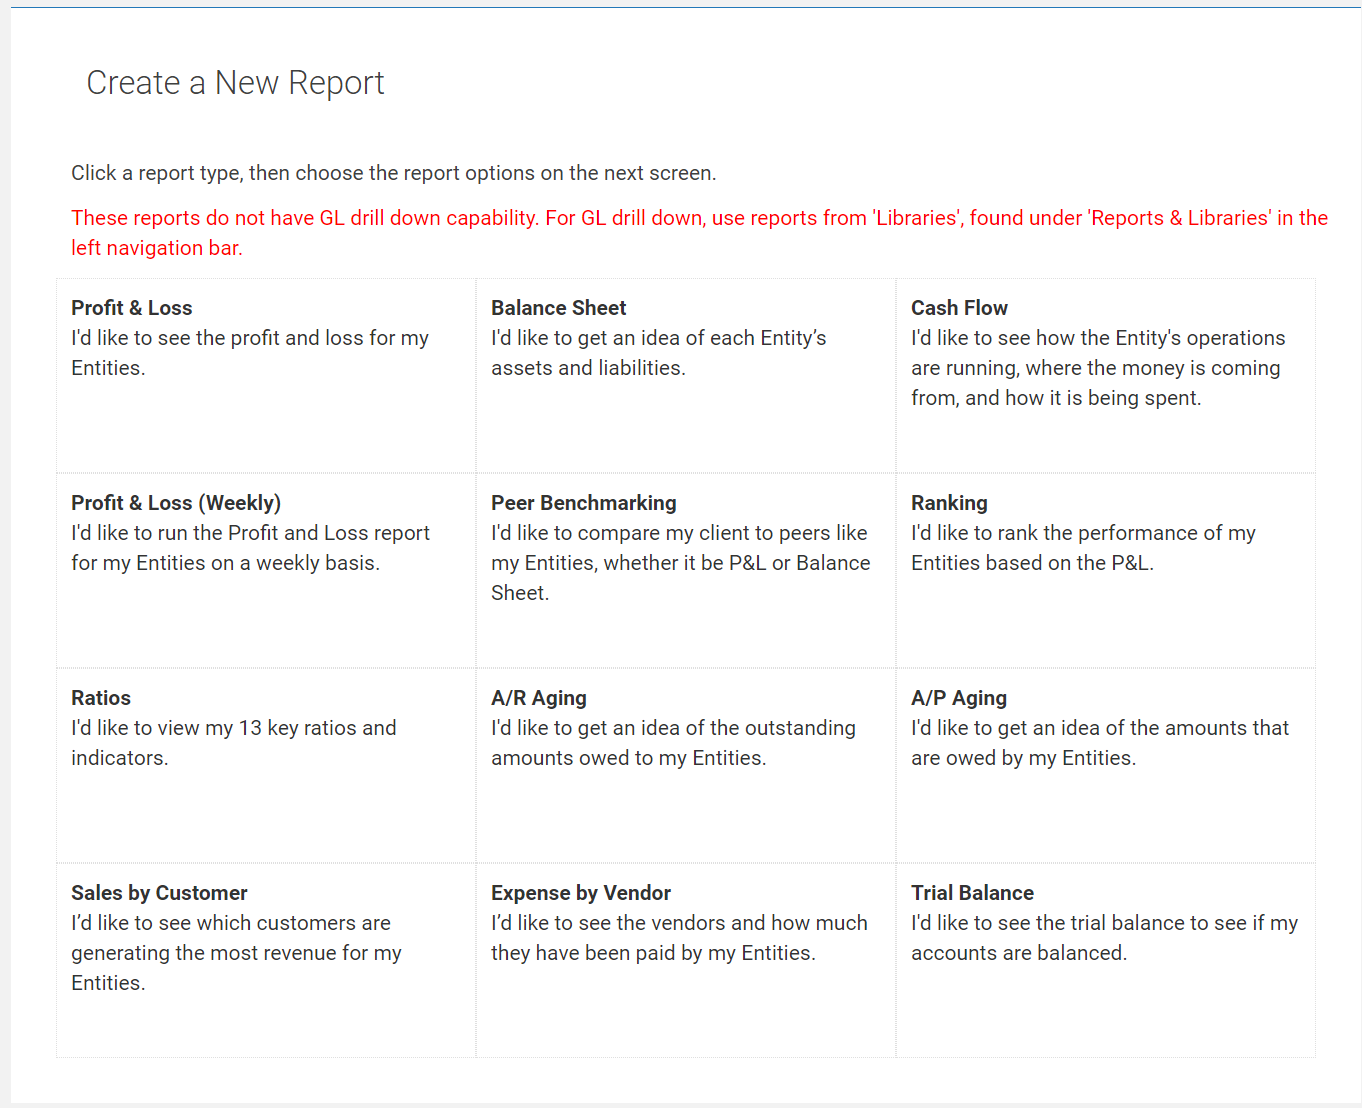
Step 2. Click the Peer Benchmarking box.
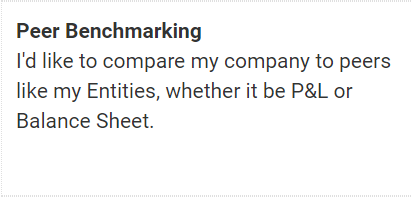
Note: These Peer benchmarking reports always run against the Standard Chart of Accounts (SCoA) and will have Account Mapping Enabled even if you have selected to run them with Account Mapping unchecked or off.
This is to protect the anonymity of the included data since native chart of account names may provide non-anonymous information if included in the report.
Step 3. On the following screen select frequency, date range, and report options.

Step 5. Press the Build My Report ![]() button.
button.
To View Reports for a Specific GROUP OF ENTITIES (Entity Permissions)
Step 1. In the navigation go to the menu Reports & Libraries > Basic Reports.

Step 2. Click the Peer Benchmarking box.

Step 3. Using the properties that have been created, click the Filter Entities ![]() option at the top of the screen, select a Property/Grouping, and Apply the filter.
option at the top of the screen, select a Property/Grouping, and Apply the filter.
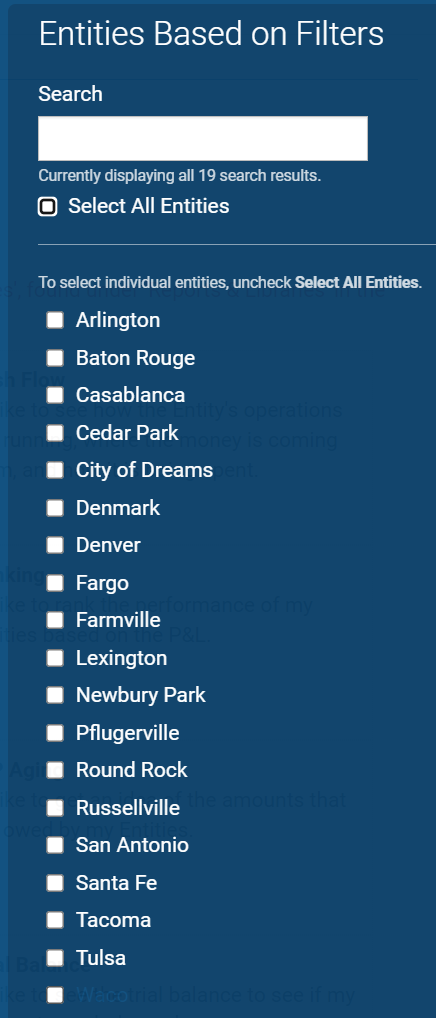
Step 4. On the following screen select frequency, date range, and report options.
Step 5. Press the Build My Report ![]() button.
button.
To View Reports for a SINGLE ENTITY
Step 1. In the navigation go to the menu Reports & Libraries > Basic Reports.

Step 2. Select the Filter Entities option at the top of the screen and under Search Entities deselect the Select All Entities option.
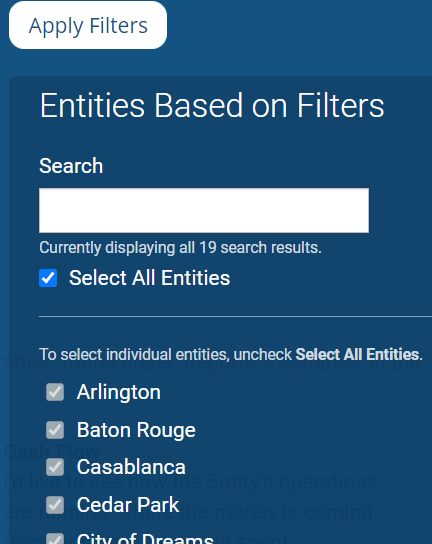
Step 4. Checkmark a single Entity or use the Search box to search for an Entity.

Step 5. Select the desired Entity and click the Apply Filters ![]() button.
button.
Step 6. Select the Peer Benchmarking report.

Step 7. On the following screen select frequency, date range, and report options.

Step 8. Press the Build My Report ![]() button.
button.
Have Questions?
We're More Than Happy to Help
Schedule a call with Customer Success below, email us at support@qvinci.com or call us at 1-512-637-7337 Ext. 1 Available M-F, 7:30am-6:30pm CT and it is always FREE!
Schedule an Appointment with Customer Success

Comments
0 comments
Article is closed for comments.